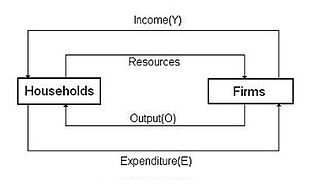
Comparative Advantage
I. Specialization
- Individuals and countries can be made better off if they will produce in what they have a comparative advantage and then trade with others for whatever else they want/need.
II. Absolute Advantage
-The producer that can produce the most output or requires the least amount of inputs (resources)
III. Comparative Advantage
- The producer with the lowest opportunity cost.
•Countries should trade if they have a relatively lower opportunity cost.
- They should specialize in the good that is "cheaper" for them to produce.
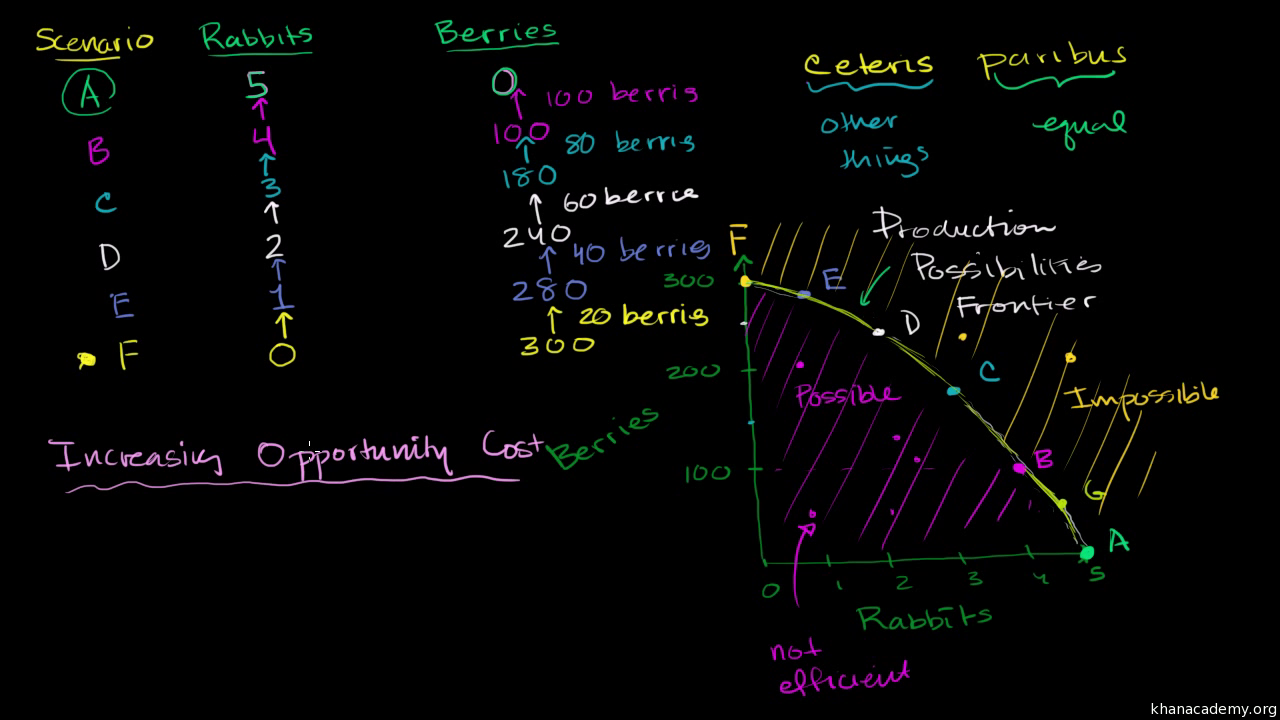
IV. Input vs. Output:
- Output problem presents the data as products produced given a set of resources (ex: # of pens produced)
- Input problem presents the data as amount of resources needed to produce a fixed amount of output (ex: # of labor hours to produce 1 bushel)
- When identifying absolute advantage, input problems change the scenario from who can produce the most to who can produce a given product with the least amount